Let’s suppose that Company A reported revenue of $50000 in 2020 and $25000 in 2019.
To calculate year-on-year growth, one would have to use the following formula:
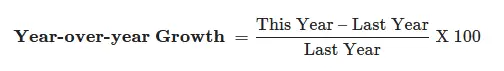
In the case of ‘Company A’ example, we would substitute the following values in the formula:
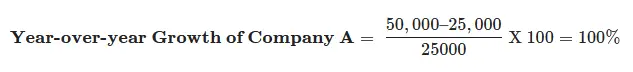
As per the calculation, Company A had a year-on-year growth of 100%.
As you must have figured out by now, year-over-year analysis entails comparing the performance of one period with the same period. The period comparison made during the Year-over-Year analysis could be annual, quarterly, or monthly. In most cases, year-on-year analysis is used to assess the financial performance of companies.
But like any other metric, YOY comes with its own set of cons. Lets’ go through them quickly so that we can be conscious of them when using the metric to make decisions.
- If we use the YOY metric to call annual values, we might not understand seasonal trends. For example, a retail company might have a significant uptick in sales in December and a downturn in may, but an annual YOY analysis would smoothen out the sales trend.
- The YOY metric, used alone to judge performance, would not give insight into why company revenue grew or shrank.
However, despite these cons, YOY has pros as well.
- The fact that the YOY analysis yields result in percentages makes it easy to compare performance with competitors.
- Since YOY is a simple math formula, one can calculate it without using a spreadsheet or calculator.
![Year-Over-Year [ Definition, Example, Pros & Cons ]](https://whatisthebusinessmodelof.com/wp-content/uploads/2021/07/YOY.png)
